Breaking Down Tasks
In a management group, someone asked for resources on teaching planning. I shared a link to this series on estimation, but quickly they came back and told me that there was something missing. The previous parts in this series assume you’re starting with a clearly defined task list, but the people this manager is teach aren’t there yet. They need help with an earlier step: “breaking down” a project into a clearly defined set of tasks.
I’ve not previously written about how to break down a task list because, to me, it largely feels intuitive. Prior to writing what follows, I think I would describe my process as: “think about the project and then write down the task list.” But that’s a deeply unsatisfying, “just draw the rest of the owl” sort of answer.
So here I’ll fill that gap, and dig into what’s going on when I break down a project into constitute tasks. I’ll start by working through an example, showing how do it, and then step back and explain the steps I took. But if you want to skip the scenic route, you can skip to the end where I’ve summarized the process.
Breaking down tasks - by example
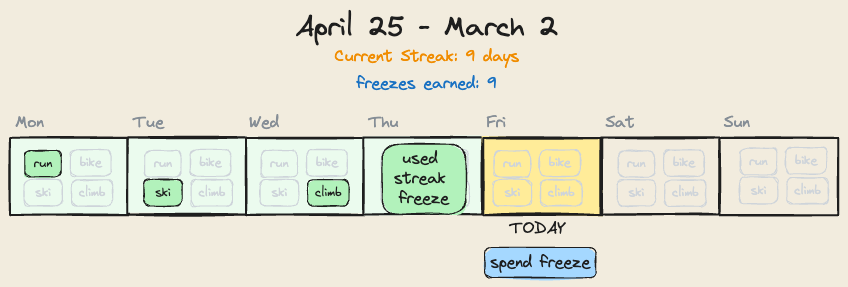
I’m building a personal streak tracker, tracking days I do some sort of outdoor activity. I want something similar to the Streaks app, except with different options for outdoor activities (running, biking, skiing, etc.), and I want to incorporate the “streak freeze” feature from Duolingo.
Iteration 1
I often start with a sketch. Having a visual mockup of what I’m going to build is a great starting point. The final result rarely ends up looking like this, but it’s a good way of articulating all the features I want in an easy-to-understand format.
Is this sufficiently “broken down”? If it’s just me, if it’s just a personal project – probably yes! For a personal project like this I’ll just sit down and start writing code now. But this is essentially just a one-step task: “build this picture”. If I’m going to delegate some of this work, or if I need to estimate how long this’ll take, I need more granularity. So I’ll continue.
Iteration 2
The next step is to expand my single-step “build this” task into its constituent pieces. I’ll think through and plan the the steps I’d need to go through to get this done. I’ll try to account for dependencies – which tasks need to come before other tasks – but I’m not worried about size or scope of the steps yet, just rough list. Here’s my first attempt:
- Model the data
- Calendar view, showing days of the current week
- Interactive calendar: click an icon records an activity and marks the day as “completed” for streak tracking.
- Calculate and show the length of the current streak
- Implement streak freezes
To keep this blog post simple, I’m ignoring deployment and other operational steps like setting up a database, etc. I’m also mostly collapsing front-end and back-end development into single steps like “build calendar view”. In a real project, especially a multi-person one, I’d have separate line items for deployment, front/backend tasks, etc., but that would quickly get more complex than I want to get for this example.
Ok, is this sufficiently “broken down”? For some purposes, maybe: I can probably produce an accurate-enough estimation of time for each step, and if I’m working with a sufficiantly-aligned and autonomous team there might be enough detail here to delegate tasks. But there’s still a good deal of uncertainty. I don’t have clear view of how freezes will be accumulated and tracked, so step 5 is a bit vague. I also don’t have anything about past history in here, adding/removing activity types, and other potential rabbit holes. Those make estimates uncertain, and mean that if I delegate a task I might not get the result I was picturing. So, I’ll continue by breaking things down even further, and add more detail.
Iteration 3
I’ll continue the same process of taking a “big” step, and breaking it down into constitution pieces, added detail as I go:
- Model the data:
- activity types: run/bike/ski/climb/etc. (hardcoded list of types is fine)
- recorded activities: date, type
- freezes: date earned, date spent
- streaks: date started, date ended, stats on count of different activity types during the streak (no need for calculation, that can come later)
- Static calendar view:
- Weekly view: shows days of the current week, recorded activities or spent freezes on that day
- Index (home page) view: shows the current week
- Monthly view: show a whole month - no individual activity types, just recorded/not recorded
- Browsing: browse backwards/forwards on the week and month views, and allow switching between weeks and months.
- “Go to date” quick entry box - don’t get fancy, no fuzzy date input, can use the html5 date widget for now
- Dynamic week calendar view (no dynamic entry on monthly views):
- clicking an activity type on a day records that day as completed
- Streak calculation and display:
- Streak calculation: walk activity history and calculate streaks — start date, end date, stats (e.g. “14 days: 9 runs, 3 bikes, 1 climb, 1 freeze”)
- Streak display: show current streak in the UI. No functionality for viewing past streaks yet
- Recording an activity in the UI recalculates streaks
- Streak freezes:
- When calculating streaks, a streak of X days (without a freeze) accumulates a streak freeze. X can be hardcoded, make up a number for now (roll a die, whatever). Freezes “roll over”: if 3 freezes are accumulated during Streak A, one is spent, and then the streak ends, you still have 2 freezes available to use on Streak B.
- Prevent “double accumulation” when recalculating streaks - make sure that if you go back in time and update an activity, causing streak recalculation, you don’t re-earn streaks.
- Add freezes to the UI: spend a freeze on a day to extend the streak, and display the number of accumulated freezes in the UI.
How about now — is this sufficiently broken down? Again the answer is contextual. I think for most engineers and most teams it is: we have clear steps, clear definitions of done, and have carefully avoided all the potential rabbit holes I can think of. I can imagine situations (junior developers, mission-critical projects with intense oversight/scrutiny) where even more detail might be necessary. But for the purposes of this example, let’s call this done.
What just happened?
Fundamentally, what I showed is an interactive process of breaking down tasks:
- Start with a list of tasks – or just one big project!
- Think through the steps you’d need to take to accomplish that task, and write them down. Don’t worry about completeness or accuracy or depth, each pass just needs to expand, even slightly, on the previous one.
- Is every task on your new list sufficiently defined? (I’ll define “sufficiently” in a minute.) If not, GOTO 1.
This algorithm is simple, but it makes some assumptions. Remember, the context here is someone who’s never done this sort of thing before, and is pretty new to software development overall. So we need to define a couple of key terms:
What’s a “task”?
Merriam-Websters defines task as … haha no, just kidding. I can do better than that.
Many people – me included – have an intuitive understanding of what “task” means, but when asked to define it, we struggle to articulate it out loud. For the purposes of talking about software development and project estimation, I think this definition is best:
- Task
- A sufficiently defined, complete piece of work that delivers change.
- Sufficiently defined because tasks need some sort of clear outline of what’s required; “work on stuff” isn’t a task. More on this in a minute.
- Complete because a task needs to encompass all of the work required. The “cut down tree” task isn’t complete if you’ve only fetched the chainsaw.
- Delivers change because, in a work context, a task only “matters” if something is different because of the work.
For the purposes of estimation, we need to go a little deeper into what “defined” means. In order for a task to be “sufficiently defined”, it needs to have “enough” detail – but the definition of “enough” is going to differ based on context. As I explored above, if it’s just me, a simple sketch is “sufficiently defined”, but in other contexts we need more detail. Still, although there isn’t one globally-applicable definition of “sufficiently defined”, I think there is a common-enough definition to be useful as a starting point.
What is “sufficiently defined”?
A task is sufficiently defined if the person working on the task1 can answer “yes” to these questions:
- Do I understand what change is desired?
- Do I understand what “done” will look like?
- Can I define all the steps I would take to get to “done”? E.g., could I write down a TODO list for this task, and would it be complete?
- Assuming no blockers or dependencies, do I have all the information I need to start this task right now?
If the person working on the task, within the context of their workplace and their skillset, can’t answer “yes” to all these questions, then the task isn’t sufficiently broken down, and you should repeat the breaking-down algorithm until you can answer “yes” to these questions for all tasks on the list.
Now, there are going to be situations where you can’t decompose tasks further, or add more context, because of unknowns. Fixing bugs is often like this: you know what the change is (no more bug), you know what “done” looks like (bug is fixed), but you can’t know all the steps. There are techniques you can employ in these situations – timeboxing is my favorite – but a deep discussion here is out of scope.
This is a skill, and it takes practice
It’s important to point out at this point that this is a skill, and it takes practice to develop to the point where it’s easy. If you’re new to this kind of thinking, you’ll probably find it doesn’t come particularly easy – and that’s normal.
Take, for example, what I did above in iteration 2: how did I know, or how did I decide, that “model data” was going to be the first step? Why wasn’t step 1 “design the interface”, or “write the streak calculation algorithm”, or anything else?
The answer is deeply unsatisfying to people new to this kind of work: it was largely intuitive. I know, for decades of experience writing software, that when I’m working on tools like this, things go better when I model data first. I also know that I’ll be using Django, which has better affordances for a model-data-first workflow. There’s no algorithm here: I’m essentially pattern-matching this project against all the other projects I’ve worked on or seen, and, based on that experience, intuiting the right steps in the right order. Which means, of course, if you haven’t seen a bunch of projects like this one, it can be incredibly difficult to know where to start!
There are no shortcuts here; the only way to learn is by doing. Which means, to circle all the way back to the discussion that inspired this piece: the best thing this manager can do to help her team get better here is give them safe opportunities to try it out. Ask for project plans, help them break them down, give feedback – but don’t penalize them when they’re wrong. Because they’ll probably be quite wrong, at first, but in a safe learning environment those mistakes become the data they’ll pattern match against the next time, and get better and better.
Summary: breaking down tasks, the algorithm
Begin where you are: with a list of tasks, a sketch, or even just an idea.
Think through the steps you’d need to take to accomplish that task, and write them down. Don’t worry about completeness or accuracy or depth, each pass just needs to expand, even slightly, on the previous one.
For each item on your list, decide if that item is sufficiently defined:
- Do I understand what change is desired?
- Do I understand what “done” will look like?
- Can I define all the steps I would take to get to “done”?
- Assuming no blockers or dependencies, do I have all the information I need to start this task right now?
If the answer to any of these questions is “no”, take that task and recurse - breaking it down further using this algorithm again.
Repeat until all tasks are sufficiently broken down.
How’d it go?
As usual, if you try this out and it works for you or doesn’t, I’d love to hear about it! Get in touch.
Bonus: estimating this project
Because this a series on estimation, it seems reasonable to complete the work and produce an estimate for this project:
| Task | Complexity | Uncertainty | Expected (days) | Worst-case (days) |
|---|---|---|---|---|
| 1. model data | x-small | low | 0.5 | 0.5 |
| 2a. weekly view | x-small | low | 0.5 | 0.5 |
| 2b. home page view | x-small | low | 0.5 | 0.5 |
| 2c. monthly view | x-small | low | 0.5 | 0.5 |
| 2d. browsing | small | low | 1 | 1.1 |
| 3. dynamic week | small | low | 1 | 1.1 |
| 4a. streak calculation | medium | moderate | 3 | 4.5 |
| 4b. streak display | x-small | low | 0.5 | 0.5 |
| 4c. streak recalculation | medium | low | 3 | 3.3 |
| 5a. freeze accumulation | medium | moderate | 3 | 4.5 |
| 5b. prevent double accumulation | small | extreme | 1 | 5 |
| 5c. freeze spending | small | moderate | 1 | 1.5 |
| Total: | 15.5 days | 23.5 days |
In reality, this overestimates the work somewhat; I completed this in about a dozen evenings and one long plane ride. But I also cut some serious corners – the design is essentially non-existent – and I’m fairly sure the “freeze” algorithm has some silly bugs I’ll run into eventually.
In some contexts, certain observers - project managers, key stakeholders, auditors, etc. – also need to be able to answer “yes” to these questions. ↩︎